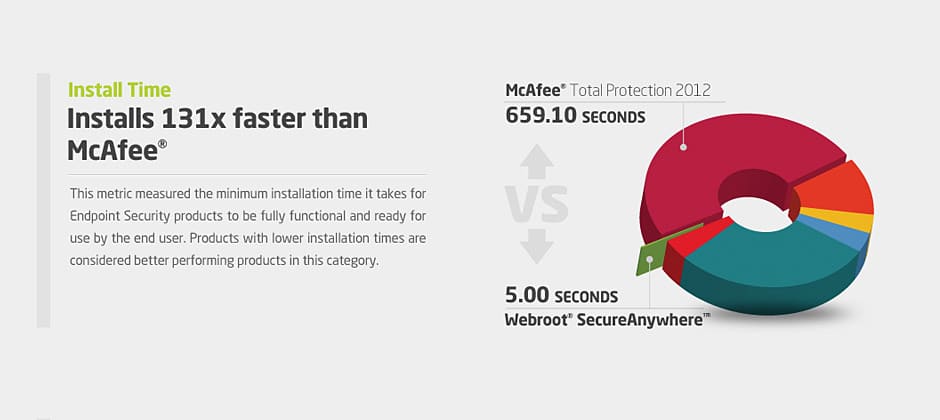
As part of an ongoing business relationship with Webroot, a local security-solutions company based in Broomfield, Colorado, we translated recent competitive analysis data by Passmark Software into compelling web infographic designs to help communicate the effectiveness of their innovative products when compared to their competition. The previous presentation of this data on the company website utilized simple and hard to read graphs and charts, which were difficult to read, and did not effectively communicate how powerful and different these new products are. The goal for this web infographic design project was to simplify the presentation of the data within the web page design to help communicate the results in an easy to digest way.
Infographic Design Process
The primary desired outlet for the series of web infographics we created was the Webroot company website, but the infographics themselves were also utilized in several print marketing and sales materials. For this reason, we started our design process in Adobe Illustrator, and using the graphing and charting functionality we created the framework for the data-driven charts and graphs. The colors used in the graphics reflect general brand colors for the corresponding company products, and are consistent across the web infographic designs. After these initial charts were generated, they we extruded into 3D graphics with depth and shading, and several different chart styles were used to help illustrate the differences in the types of data being shown.
The vector web infographic designs were them pulled into Adobe Photoshop, and incorporated into the web design layout for the company website competitive compare page. Large, high-contrast titles were chosen to draw attention to a key competitive analysis from the passmark report product comparisons, along with a modest amount of text describing the comparison metrics. A key decision we made for the page infographic design was to compare Webroot products to a variety of their competitors, not necessarily the worst performing product.
The design revision process involved delivering static images for the infographic web pages for review and approval to Webroot employees, and incorporating detailed feedback over several rounds of revisions to reach a finalized design. The approved PSDs were sent to in-house developers at Webroot to code and develop the page within their internal content management system, and were ultimately deployed to their production website.
Existing Brand Considerations
Brand considerations are a key factor on all projects we complete for companies with existing brand styles and guidelines. These infographic designs use approved company fonts and colors wherever possible in the page layout and design elements, but also introduce new styles within the page to best communicate the intended message within the web page design. Existing technologies used on the company website were also taken into consideration when designing the infographics and web pages to insure that the designs could be easily and quickly implemented by the internal development team.
About the Client
Founded in 1997, the company provides best-of-breed security solutions that protect personal information and corporate assets from online and internal threats. Based in Broomfield, Colo., the company is privately held and backed by some of the industry’s leading venture capital firms, including Technology Crossover Ventures, Accel Partners and Mayfield. Webroot currently has approximately 400 employees worldwide.


